
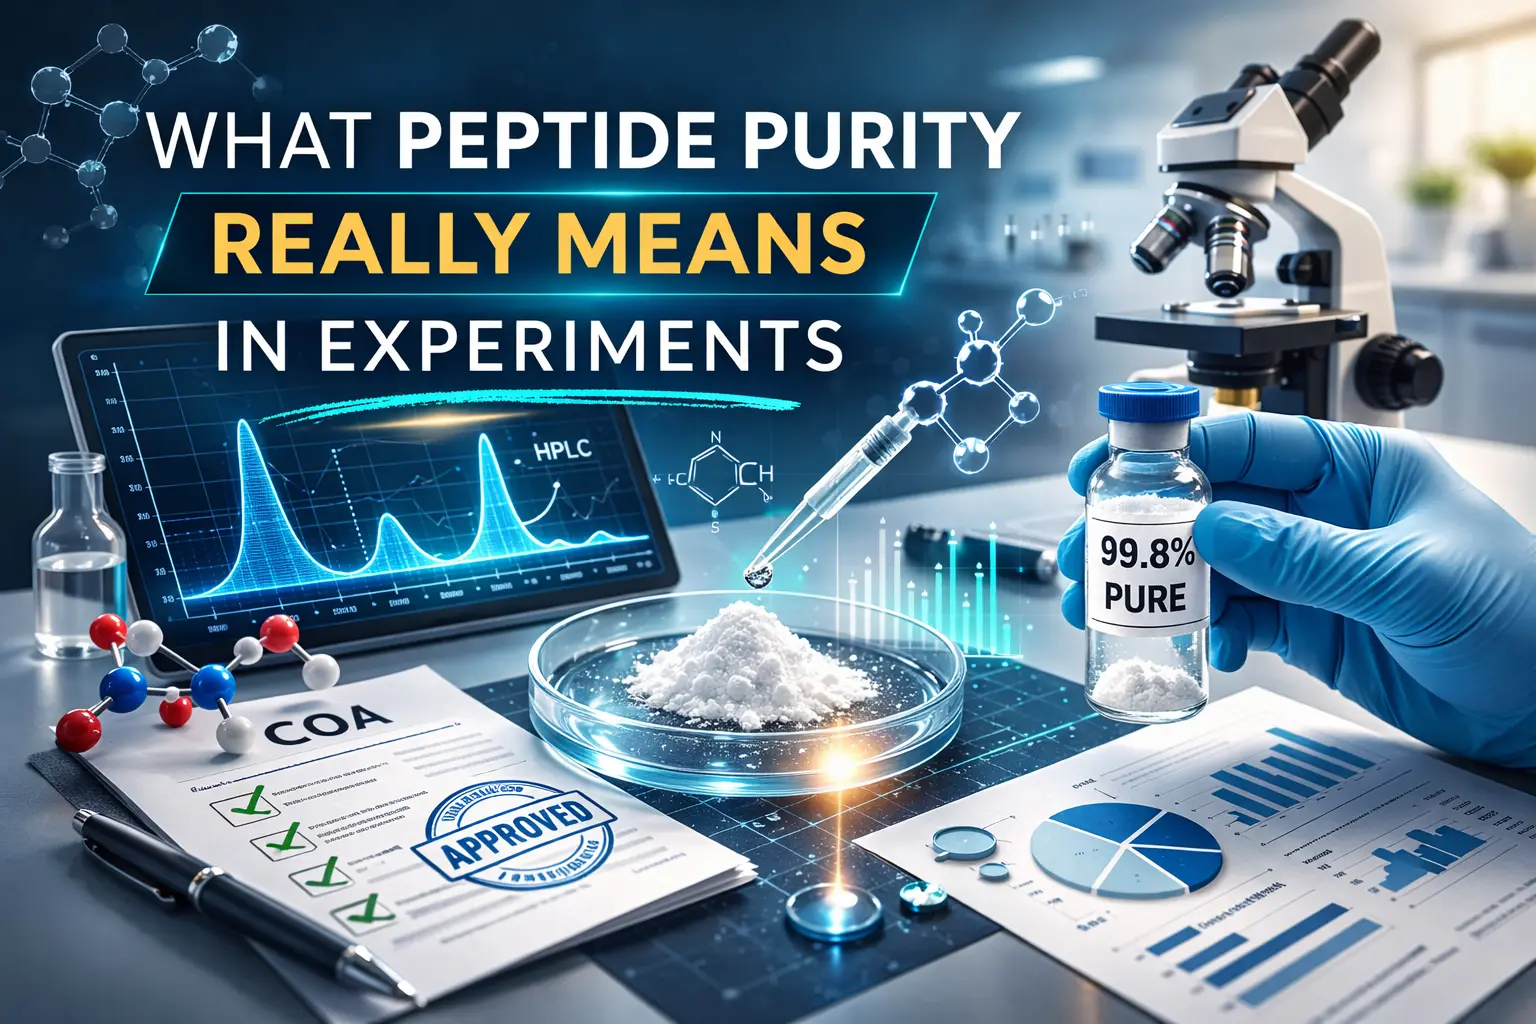

Peptide purity refers to the percentage of the sample that corresponds to the main peptide peak under a specific analytical method, usually HPLC. When a COA reports 95% or 99% purity, it means that this percentage of the detected chromatographic signal belongs to the intended peptide compared to other peptide-related impurities.
It does not mean the vial contains 99% active material by weight. It does not mean the peptide is sterile, stable, or biologically effective. It simply reflects analytical separation under defined testing conditions.
Purity is method-dependent. The reported percentage can vary slightly depending on the chromatography system, solvent gradient, detection wavelength, and instrument calibration. That is why purity should always be interpreted within the context of how it was measured.
In experiments, purity is a measure of chemical cleanliness, not functional guarantee.
How Peptide Purity Is Measured
Peptide purity is most commonly measured using High-Performance Liquid Chromatography, or HPLC.
In this method, the peptide sample is injected into a chromatography column. As the mixture travels through the column, different components separate based on their chemical properties. Each component appears as a peak on a chromatogram. The main peak represents the target peptide. Smaller peaks represent impurities such as truncated sequences, deletion variants, or minor synthesis byproducts.
Purity is calculated as the percentage of the total detected signal that belongs to the main peak. For example, if the main peak accounts for 97% of the total peak area, the peptide is reported as 97% pure.
However, there are limitations.
HPLC purity is based on UV absorbance detection. Some impurities may not absorb strongly at the selected wavelength and could be underrepresented. Conversely, very small peaks may be exaggerated or minimized depending on the auto-scaling of the chromatogram display.
Highly pure samples sometimes appear as a single sharp spike. This visual simplicity is often due to signal scaling and does not necessarily mean impurities are absent.
HPLC purity tells you how clean the peptide is relative to peptide-related contaminants. It does not measure water content, counter-ions, biological activity, or net peptide mass.
Understanding how purity is measured prevents overinterpreting what a high percentage truly represents.
Purity vs Net Peptide Content
One of the most common misunderstandings in peptide research is assuming that purity equals actual peptide mass.
Purity reflects how much of the chromatographic signal belongs to the main peptide compared to other peptide-related impurities. Net peptide content, on the other hand, reflects how much of the vial’s total weight is true peptide material.
These are not the same thing.
A peptide can be 99% pure by HPLC and still contain only 80–85% actual peptide by weight. The difference comes from moisture and counter-ions. Lyophilized peptides absorb atmospheric water because they are hygroscopic. In addition, peptides are typically supplied as salt forms, such as TFA or acetate. These counter-ions remain associated with the molecule and add mass without contributing to the peptide backbone.
For example, a vial labeled 10 mg with 80% net peptide content contains only 8 mg of true peptide. If concentration calculations are based on the full 10 mg, the resulting solution will be inaccurately diluted.
Purity describes chemical cleanliness. Net peptide content describes quantitative reality. Both must be considered in experimental design.
What Peptide Purity Does NOT Mean
High purity percentages can create false confidence if they are misunderstood.
Purity does not guarantee biological activity. A peptide may be chemically clean but inactive due to incorrect folding context, degradation during storage, or inappropriate assay conditions.
Purity does not confirm sterility. Unless endotoxin or microbial testing is specifically included, a high purity number says nothing about biological contamination.
Purity does not ensure long-term stability. Oxidation, hydrolysis, or aggregation can occur after testing, especially if storage conditions are suboptimal.
Purity also does not guarantee correct dosing. Without adjusting for net peptide content, molar concentration calculations may be inaccurate.
In experiments, purity is one quality parameter among several. It reduces the likelihood of interference from synthesis-related impurities, but it does not eliminate all experimental risks.
Understanding what purity does not mean is just as important as understanding what it does.
Types of Impurities in Peptide Synthesis
When a peptide is reported as 95–99% pure, the remaining percentage represents detectable impurities. Understanding what those impurities are helps interpret potential experimental impact.
One common impurity type is truncated sequences. These occur when peptide synthesis stops prematurely, resulting in shorter versions of the intended sequence. Even small truncations can alter binding behavior or reduce activity.
Deletion variants are another possibility. In this case, a single amino acid may be missing from the sequence. Because peptides rely on precise amino acid order, even one missing residue can change structure or function.
Oxidation is also common, especially for residues such as methionine, cysteine, or tryptophan. Oxidized forms may appear as minor peaks in HPLC and can subtly affect biological response.
Other impurities may include residual protecting groups or minor synthesis byproducts. While these are usually present at low levels, sensitive assays can sometimes detect their influence.
Not all impurities are equally problematic. The experimental context determines whether 1–3% impurity matters or not.
How Impurities Affect Experimental Results
Even small impurity levels can influence experimental outcomes, depending on assay sensitivity.
In receptor binding studies, truncated sequences may compete weakly with the intended peptide. This can slightly reduce apparent binding affinity and shift calculated dissociation constants.
In dose–response experiments, impurities can distort curve shape. If a minor component has partial activity, it may flatten the response or alter EC50 values.
Impurities can also influence solubility and aggregation. Certain truncated or hydrophobic fragments may promote aggregation at higher concentrations, changing effective peptide availability in solution.
Reproducibility is another concern. Two batches both labeled 97% pure may differ in impurity profile. Even if the total impurity percentage is similar, the specific impurity composition may vary, leading to subtle experimental differences.
In many routine laboratory experiments, small impurity levels have minimal practical impact. But in high-precision studies, especially those involving quantitative binding or structural analysis, purity differences can become significant.
Understanding impurity type and context helps determine whether higher purity is necessary for a given experiment.
When Higher Purity Really Matters
Not every experiment requires ultra-high purity peptides. However, certain research settings demand tighter control.
In receptor binding and signaling assays, even small impurities can compete with or partially activate the target. If you are calculating precise EC50 or IC50 values, a 2–3% impurity can introduce measurable variability. In such cases, higher purity improves confidence in quantitative results.
Structural biology experiments also benefit from high purity. Techniques such as NMR or crystallography rely on uniform molecular populations. Minor variants can broaden signals, complicate spectra, or prevent consistent structural interpretation.
In vivo studies represent another scenario where higher purity is important. Impurities may influence pharmacokinetics, toxicity, or immune response. When moving beyond in vitro screening, stricter purity standards reduce biological uncertainty.
Higher purity is not about achieving a perfect number. It is about minimizing variables in experiments where precision matters most.
When Standard Research Purity Is Sufficient
For many exploratory or early-stage studies, extremely high purity is not essential.
Mechanistic mapping experiments, where researchers are identifying minimal binding regions or testing qualitative activity, often tolerate 95% purity without significant impact.
High-throughput screening studies also prioritize scalability and cost efficiency. In these contexts, slightly lower purity may be acceptable if the goal is identifying trends rather than final quantitative parameters.
Budget considerations also play a role. Increasing purity from 95% to 99% often requires additional purification steps, which increase cost and reduce yield. If the experiment does not require high-precision measurements, standard research-grade purity may be sufficient.
The key is matching the purity level to the experimental objective.
Purity should be selected based on scientific need, not marketing appeal.
How to Evaluate a Purity Report Correctly
A purity percentage alone is not enough. Proper evaluation requires reading the supporting data.
Start by examining how the purity was measured. HPLC is the standard method, but method details matter. The solvent system, gradient, detection wavelength, and column type can influence separation quality. A well-documented report should reference the method used.
Next, review the chromatographic profile if available. A strong report typically shows one dominant peak representing the target peptide. Minor peaks should be small and clearly separated. The retention time should be listed and consistent with expected behavior for that peptide.
Be cautious with visual interpretation. Chromatograms are often auto-scaled. A highly pure sample may appear as a single sharp spike because the instrument compresses minor peaks to fit the display range. That does not mean impurities are absent; it means they are small relative to the main signal.
If no chromatogram image is included, look for method identifiers, report numbers, or digital traceability. Some laboratories provide numeric peak data instead of images. That can still be valid if documentation is verifiable.
Evaluating purity correctly means interpreting the data in context rather than relying solely on a headline percentage.
Practical Example: 95% vs 99% Purity in an Assay
Consider a dose–response study comparing two batches of the same peptide.
Batch A is 95% pure.
Batch B is 99% pure.
Assume both peptides are dosed at the same calculated concentration.
In Batch A, 5% of the material consists of impurities. If some of those impurities are truncated sequences with weak binding activity, they may partially compete with the main peptide. This can slightly shift the observed EC50 value or reduce maximal response.
In Batch B, only 1% consists of impurities. The likelihood of competitive interference is lower, and the dose–response curve may appear sharper and more consistent.
In qualitative screening experiments, this difference may not be noticeable. But in quantitative pharmacological modeling, a few percentage points can influence curve fitting and parameter estimation.
This example illustrates that purity differences do not automatically invalidate experiments. However, as precision requirements increase, the impact of small impurity levels becomes more significant.
Choosing between 95% and 99% purity should be based on experimental sensitivity, not just preference for the higher number.
Conclusion
Peptide purity reflects analytical cleanliness under defined testing conditions. It does not represent biological effectiveness, sterility, stability, or actual peptide mass by weight.
Understanding how purity is measured, what it includes, and what it excludes prevents overinterpretation of high percentage values. The difference between 95% and 99% purity may be negligible in some studies and critical in others.
Purity must be interpreted alongside identity confirmation and net peptide content to ensure accurate dosing and reproducible results.
In experiments, purity is not just a number on a label. It is a parameter that influences precision, reliability, and interpretation.
Choosing the right purity level begins with understanding what the number truly means.
FAQs
Is 95% purity acceptable for most laboratory experiments?
In many exploratory or early-stage studies, 95% purity is sufficient. However, for highly quantitative assays such as receptor binding or pharmacological modeling, higher purity may reduce variability and improve confidence in calculated parameters.
Why does 99% purity not mean 99% active peptide by weight?
Purity refers to chromatographic separation of peptide-related components. It does not account for moisture or counter-ions present in the vial. Net peptide content determines actual peptide mass.
Can small impurity levels really affect experimental results?
Yes, depending on assay sensitivity. Truncated sequences or modified residues can compete for binding or alter dose–response curves, particularly in high-precision experiments.
Should I always choose the highest purity available?
Not necessarily. Higher purity often increases cost. The appropriate purity level should match the precision and biological sensitivity required by your study.
How do I know if a purity report is reliable?
Look for clear analytical documentation, including HPLC method details, retention time consistency, and batch traceability. Digital verification or laboratory identification adds credibility
Sources
https://www.acslab.com/compliance/retail-how-to-read-a-coa-and-why-its-so-important
- United States Pharmacopeia (USP) <621>. Chromatography Standards.
- ICH Q2(R2). Validation of Analytical Procedures: Text and Methodology.
- U.S. FDA. Guidance for Industry: Analytical Procedures and Methods Validation.